
On-Demand Location Intelligence Reports for Physical Places
Unlike traditional location intelligence platforms, such as Placer.ai, Foursquare, Near or Pathzz, BizziRex does not require ongoing subscriptions. BizziRex delivers on-demand location intelligence report, which are ready-to-use reports fof physical sites. No technical skills are required to read the report.
Users define a physical site boundary and receive a location intelligence report based on mobility data analysis.

Meet the
Simple. Clear. Actionable.
From real visitor and passer-by data into clear, actionable insights — no technical skills required.
Designed for business owners, investors, marketers, urban planners + more.
_edited.png)
OUR METRICS
What's Included?
Six easy-to-read metrics about visitors and people passing by.
Visitors Stay Time & Return Visitors
See real foot traffic.
Understand how long visitors stay at your selected location.
METRIC INCLUDES:
-
Average stay time of visitors for the whole report period.
-
Average stay time of visitors for each day of the week.
-
Visitors return rate.
-
Average number of times return visitors return.
Visitors Stay Time - Extended
Know who comes back.
Reveal how long visitors stay at different times of the day.
METRIC INCLUDES:
-
Average visitor stay time by time of day (morning, midday, evening, and night) for each day.
'Bizzi' Hours of the Day
Hottest times of day.
Uncover the busiest hours of the day at your selected location.
METRIC INCLUDES:
-
Daily visitor and passer-by counts across the week.
-
Visitor and passer-by counts by time of day (morning, midday, evening, and night) for each day of the week.
Where Visitors Live
By neighborhood.
See where your visitors live and how far they’re willing to travel to reach the area.
METRIC INCLUDES:
-
Percentage of local, regional and distant visitors.
-
Ranking of SA2s and names of areas where visitors live.
-
Percentage visitor count by home SA2.
-
Heatmaps of where visitors live.
Visitor Demographics
Age, gender, visitor mix.
Understand the demographics about your typical visitor.
METRIC INCLUDES:
-
Visitors’ higher education levels compared to the national average.
-
Visitors’ gender distribution and average age, compared to the national average.
-
Visitors’ household weekly income compared to the national average.
-
Visitors’ household size compared to the national average.
-
Visitors’ family composition compared to the national average.
Actionable Insights
Data-driven guidance.
Clear guidance based on key highlights from previous metrics.
METRIC INCLUDES:
-
Metrics' highlights
-
Data-driven strategic insights
CUSTOM REQUESTS
Other Valuable Insights
Reveal exactly how people navigate your area of interest by ordering a

BizziRex Visitor Movement Heatmap for a stadium area of interest, displaying dynamic flow patterns of attendees prior to an event. This custom footfall analysis identifies primary transport corridors, essential for event logistics, infrastructure planning and transport engineering.
BizziRex Visitor Movement Heatmap for a stadium area of interest, displaying dynamic flow patterns of attendees prior to an event. This custom footfall analysis identifies primary transport corridors, essential for event logistics, infrastructure planning and transport engineering.
ON LAND
VISITOR MOVEMENT HEATMAP
of stadium attendees prior to the event

BizziRex Visitor Stay Heatmap showing high-dwell areas near a stadium. This geospatial analysis provides visitor insights into where crowds congregate before attending a game, supporting targeted marketing and safety management through evidence-based location intelligence.
BizziRex Visitor Stay Heatmap showing high-dwell areas near a stadium. This geospatial analysis provides visitor insights into where crowds congregate before attending a game, supporting targeted marketing and safety management through evidence-based location intelligence.
ON LAND
VISITOR STAY HEATMAP
of stadium attendees prior to the event

Custom footfall analysis by BizziRex for main Park in Brisbane, tracing visitor movement patterns within the park's area of interest. Ideal for urban planning and landscape design validation using high-resolution mobility data


Custom footfall analysis by BizziRex for main Park in Brisbane, tracing visitor movement patterns within the park's area of interest. Ideal for urban planning and landscape design validation using high-resolution mobility data
ON LAND
VISITOR MOVEMENT HEATMAP
Victoria Park, Brisbane

BizziRex custom Stay Heatmap for a main Park in Brisbane, highlighting stationary behavior and popular congregation spots. These visitor insights allow park managers to optimize facility placement and improve user experience based on actual usage patterns


BizziRex custom Stay Heatmap for a main Park in Brisbane, highlighting stationary behavior and popular congregation spots. These visitor insights allow park managers to optimize facility placement and improve user experience based on actual usage patterns
ON LAND
VISITOR STAY HEATMAP
Victoria Park, Brisbane

BizziRex On Water Movement Heatmap for Tangalooma, Moreton Island, showing vessel and visitor flow patterns. This specialized geospatial intelligence supports marine authorities in monitoring activity within a maritime area of interest.


BizziRex On Water Movement Heatmap for Tangalooma, Moreton Island, showing vessel and visitor flow patterns. This specialized geospatial intelligence supports marine authorities in monitoring activity within a maritime area of interest.
ON WATER
VISITOR MOVEMENT HEATMAP
Tangalooma, Moreton Island

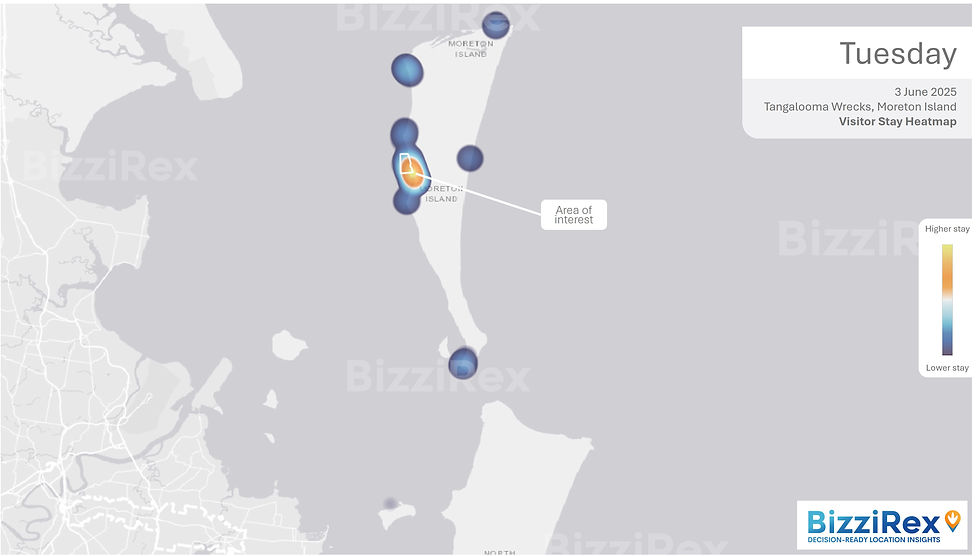
Marine Stay Heatmap for the Tangalooma maritime region, pinpointing where vessels and visitors remain stationary. This custom geospatial analysis provides critical visitor insights for coastal management and environmental impact studies.

Marine Stay Heatmap for the Tangalooma maritime region, pinpointing where vessels and visitors remain stationary. This custom geospatial analysis provides critical visitor insights for coastal management and environmental impact studies.
ON WATER
VISITOR STAY HEATMAP
Tangalooma, Moreton Island
HOW TO USE
Explore Our Free Example Reports
Understand who uses and how to use the Location Intelligence Report
Choose your free sample report of interest below:
Grow your
commercial business
-
Know your foot traffic passing by and visitors to drive business growth.
-
Get insider insights about your competitor visitors by ordering a report.
-
Get more customers with targeted advertising and marketing.
-
Tailor your goods and services.
-
Save costs with staffing and operations.
HOW TO USE
EXAMPLE USERS
-
Shop, Restaurant and Cafes.
-
Entertainment venues.
-
Offices.
DOWNLOAD YOUR
FREE EXAMPLE REPORT:
Planning, design
& management
-
Plan and design urban spaces based on visitor and passer-by volume and trends.
-
Optimise and monitor the use of public infrastructure over time.
-
Analyse movement patterns across different urban areas.
HOW TO USE
EXAMPLE USERS
-
Engineering, planning and design consultants.
-
Government.
DOWNLOAD YOUR
FREE EXAMPLE REPORT:
Property investment, insurance, banking
& real estate
-
Support sales, acquisition, leasing, and development due diligence with objective data.
-
Compare site analytics to assess and select the right location.
-
Reduce uncertainty and improve confidence in site-related decisions.
-
Support insurance and valuation estimates.
-
Support smarter investment decisions.
HOW TO USE
-
Property and development professionals.
EXAMPLE USERS
-
Real estate and investors.
-
Insurers and valuers.
DOWNLOAD YOUR
FREE EXAMPLE REPORT:
Marine & on water
Our data goes beyond land — it flows on water too!
-
Understand vessel movements.
-
Identify popular routes and anchorage spots with precision.
-
Get more customers with targeted advertising and marketing.
-
Optimise marina operations, environmental management, disaster planning.
-
Plan new facilities or services where demand is highest.
HOW TO USE
EXAMPLE USERS
-
Marine & port authorities.
-
Infrastructure developers.
-
Tourism.
-
Government.
DOWNLOAD YOUR
FREE EXAMPLE REPORT:
Major events & tourism
-
Understand visitor origin and mobility patterns to optimise transport, access routes, and event logistics.
-
Measure traffic peaks and crowd dynamics during major cultural, sports, or seasonal attractions.
-
Identify popular hotspots and movement corridors to maximise the impact of local commerce and sponsorships.
-
Optimise city infrastructure and public services (security, sanitation, transit) based on historical event demand.
-
Evaluate economic and spatial impacts of events to justify future investments.
HOW TO USE
EXAMPLE USERS
-
Event organisers.
-
Tourism organisations
-
Local governments,
-
Transport authorities.
DOWNLOAD YOUR
FREE EXAMPLE REPORT:
