
- Jun 18
- 4 min read
Updated: 7 days ago
BIZZIREX ARTICLE
How BizziRex Powered the 2026 NRL Magic Round Event Mobility Data Behind the Brisbane Times Article

By Dr. Nicholas Patorniti, Emma Tremble, Murilo Colin and Raiza Benedecti
BizziRex Co-Founders
The recent Brisbane Times publication, “How fans travelled to Brisbane’s latest mega-event and our lessons for 2032" (read the full article here), spotlighted a critical conversation: how Brisbane's current transport grid handles massive influxes of people and what that means for the fast-approaching 2032 Olympic and Paralympic Games.
But where did the event mobility data come from?
Behind those headlines was a sophisticated, high-fidelity spatial data analysis prepared by BizziRex. As an industry leader in on-demand location intelligence and raw-data mobility analytics, BizziRex deployed its proprietary processing frameworks to map the exact digital footprints of the 2026 NRL Magic Round weekend.
For urban planners, event organisers, and commercial property stakeholders, the public news only scratched the surface. Here, we reveal the deep-dive spatial insights and granular attendees patterns that didn't make the front page—showcasing how modern location intelligence bridges the gap between raw GPS signals and decision-ready infrastructure strategies.

Unlocking the Deep Spatial Insights - Analysing the Mega Event Mobility Data
While mass media focused on broad public transport percentages, BizziRex’s full Area of Interest (AOI) analysis revealed complex human movement vectors and micro-mobility patterns essential for true catchment area diagnostics.
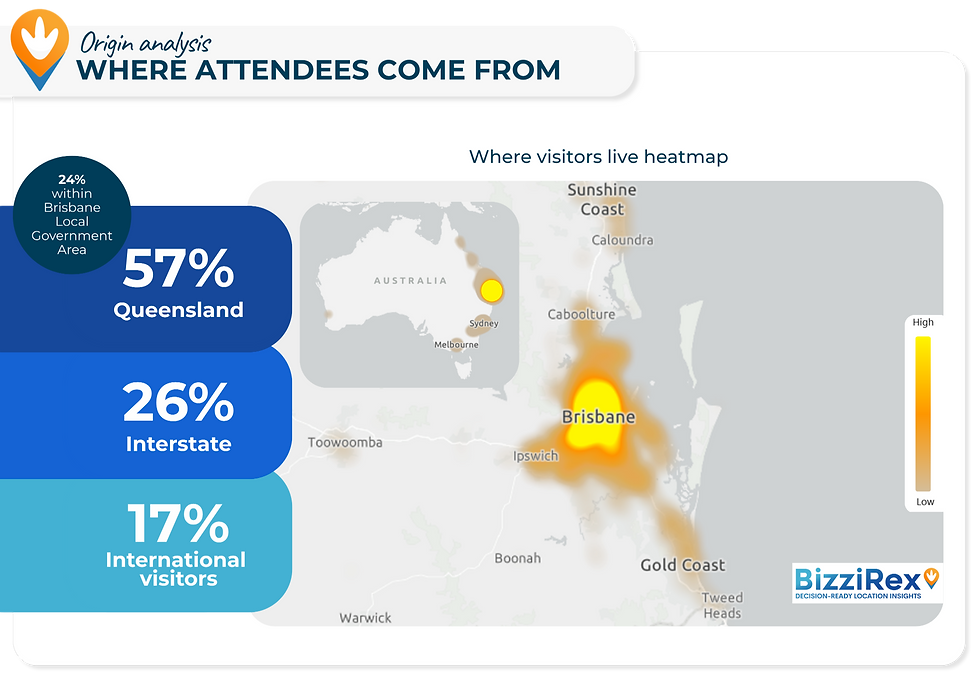
1. The Magic-Round Catchment Area
The geographic footprint of the 2026 NRL Magic Round attendees reveals a diverse distribution of visitors. The metrics demonstrate that while a strong majority of 57% reside within Queensland—including 24% localised within the Brisbane Local Government Area—the event remains a massive external drawcard, capturing 26% interstate attendees and a significant 17% footprint of international visitors.
2. The Pre-Event Velocity vs. Post-Event Friction
Our regional movement heatmaps tracked attendees exactly two hours before arrival and two hours after departure from the Suncorp Stadium boundary. The contrast is stark:
The Arrival: Regional transport networks faced massive simultaneous pressures from north and south corridors, with a heavy reliance on highway infrastructure bringing road users down from the Sunshine Coast and north from the Gold Coast.
The Departure: Conversely, two hours after leaving the stadium, regional dissipation virtually flatlined. Instead, movement was strictly confined within a 5km highly localized radius, saturating the immediate urban core.


3. Mapping the Footprint: A Chronological Deep-Dive into Attendee Stays
To truly understand how a mega-event compromises or activates an urban grid, we must look at where people stop, gather, and linger. Our Magic Round Attendee Stay Heatmaps filter out transient movement, capturing only high-fidelity "stay points" where visitors remained stationary.
By analysing the four distinct temporal phases below, BizziRex provides the exact expansion and contraction of attendees behaviour.
4 to 2 Hours Before – The Decentralised Gathering:
Highly distributed network of micro-clusters across the wider Brisbane metropolitan area. Attendees are heavily engaged in decentralised, event-related activities—gathering at local hubs and regional entry points. Even at this early stage, early-bird congestion begins building around major arterials, but the urban core remains relatively open.
2 to 0 Hours Before – The Funnel Effect & The Caxton Street Ignition:
As the countdown to the event narrows, the distributed clusters rapidly collapse into a hyper-localised footprint. The data captures an intense spatial ignition along Caxton Street, which serves as the primary fan activation hub for ticket holders.
The heatmaps clearly illustrate a massive orange "hot spot" radiating directly off Caxton Street and the immediate eastern gates of Suncorp Stadium. This indicates thousands of concurrent visitors spending significant dwell time pre-gaming and soaking up the atmosphere before crossing the property boundary.

0 to 2 Hours After – The Localised Saturation:
The post-event heatmap reveals a stark, high-density containment zone. Rather than dispersing back to their points of origin, tens of thousands of attendees flood directly back into the immediate hospitality strips. Caxton Street once again flashes white-hot, absorbing the initial wave of stadium egress.
2 to 4 Hours After – The Urban Core Migration:
Hours after leaving stadium gates close, the localised pressure finally begins to shift. The final phase of our stay analysis tracks a clear migration vector moving away from the stadium gates and bleeding deeper into the Brisbane CBD and surrounding entertainment precincts.
While suburban areas show minor, isolated stay points as people finally make it home, the primary commercial density remains locked within the city's urban core, proving that mega-events drive sustained night-time economy activation long after the final whistle blows.

4. Micro-Stay Behavior & The SA2 Boundary Movements
Using Australia’s Statistical Area Level 2 (SA2) geographical boundaries, BizziRex stripped out overnight accommodation data and stadium-internal data to map pure "awake time" commercial engagement.
The 10km Concentration Ring: A massive 60% of all event attendees spent their pre- and post-event day hours concentrated within a tight 10km radius of Suncorp Stadium.
High-Efficiency Footprints: Rather than wandering across the city, the majority displayed highly efficient movement profiles. Over 65% of attendees moved across 3 or fewer SA2s during the entire 3-day event window. They chose hyper-local pockets to eat, drink, and gather.

5. Hyper-Local Activation Hubs: A Tale of Two Squares
From the event mobility data, the granular spatial stay metrics revealed completely divergent consumer behaviors between the city's two primary activation footprints for the 2026 NRL Magic Round ticket holders:
The Caxton Street Fan Activation Hub
The Ticket-Holder Magnet: This hub acted as a direct extension of Suncorp Stadium, drawing in over 2,500 ticket holders.
High Commercial Dwell Time: Ticket holders didn't just pass through; they recorded an average stay time of 53 minutes. Across all visitors (ticketed and non-ticketed), the overall average dwell time climbed to 65 minutes, peaking on Sunday evening with an intensive 78-minute average dwell time per person.
Loyalty and Recurrence: 13% of visitors returned to Caxton Street multiple times across the weekend, averaging 2 distinct visits.

The King George Square Fan Activation Hub
The Volume Leader: King George Square actually generated far superior overall foot traffic, pulling in 31,410 total visitors over the 3 days (compared to Caxton Street's 12,510) .
Ticket-Holders: Despite the massive crowds, only 143 stadium ticket holders stepped foot into King George Square on the weekend. Their average dwell time there was a mere 4 minutes.
The Takeaway: King George Square functioned beautifully as a local civic celebratory zone for 2026 NRL Magic Round non-ticket holders.
